
Sodiko sees where its energy goes
By Jorg Hendrikx, CEO, VlegelPublished on Updated on Reading time: 4 min
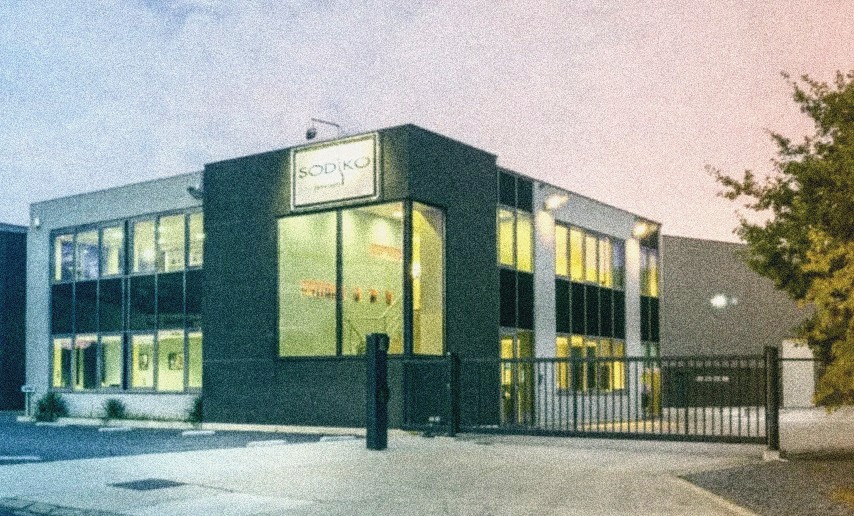
- Customer
- Sodiko
- Location
- Diepenbeek, Belgium
- Sector
- Drinks
Sodiko was already measuring energy use, but couldn’t see where, when or why consumption peaked. We connected the meters and machines, brought the data into one place and built a dashboard for each department. Now Sodiko sees a spike as it happens, not later on the bill.
What was the challenge?
Energy is a major cost for a bottling plant. Prices fluctuate, and customers and regulators increasingly ask for sustainability figures.
Sodiko didn’t just want to cut costs. First, it wanted to understand: which department uses what, when, and why?
What did we do?
- Connected. Energy meters and machines send their data to one system.
- Collected. All data is in one place, with a clear name and meaning for every measurement.
- Made it clear. A dashboard shows consumption by department, and when the peaks occur.
- Took control. Lighting, cooling and machines are controlled based on what they actually use.
What does it deliver?
- Insight into each department’s consumption, as it happens.
- Better maintenance and investment decisions, based on figures rather than gut feeling.
- Lower peaks through more targeted control.
- A clear overview for sustainability reporting.
The energy manager no longer waits for the bill. They see a spike as it develops and can step in before it gets expensive.
What can you learn from this?
Measurement isn’t the problem. Most factories have plenty of meters. The difference lies in making connections: linking the meter to the machine, the department and the time. Only then can you see why consumption peaks.
And that historical data stays valuable. Data with a name, a meaning and a timestamp is exactly what you need to start predicting peaks later, rather than just spotting them.
Frequently asked questions
What’s the difference between energy monitoring and energy management?
Monitoring shows what you use. Management means acting on it too: avoiding peaks, controlling equipment more intelligently and making decisions based on the figures.
Do I need new meters?
Not always. Often, meters are already in place, but aren’t linked to machines or departments. Connecting them then delivers more value than adding more measurements.
Does energy data help with sustainability reporting?
Yes. Consumption data by department and period gives you the figures reporting requires, without the manual work.