
Improving OEE: what it is, how to calculate it and where to start
By Jorg Hendrikx, CEO, VlegelPublished on Updated on Reading time: 6 min

OEE (Overall Equipment Effectiveness) shows how much of your planned production time actually produces good products. An OEE of 72% means that, for every 100 planned minutes, 72 deliver good products at full speed. The other 28 minutes are lost to downtime, slower running or rejects.
What does OEE measure?
OEE combines three types of loss:
- Availability: how much of the planned time is the machine actually running? This accounts for downtime, breakdowns and changeovers.
- Performance: is it running at the speed it should achieve? This accounts for slower running and microstops.
- Quality: how much of what it makes is good? This accounts for rejects and rework.
How do you calculate OEE?
| Factor | Formula |
|---|---|
| Availability | run time ÷ planned production time (run time = planned production time − downtime) |
| Performance | (ideal cycle time × total units produced) ÷ run time |
| Quality | good units ÷ total units produced |
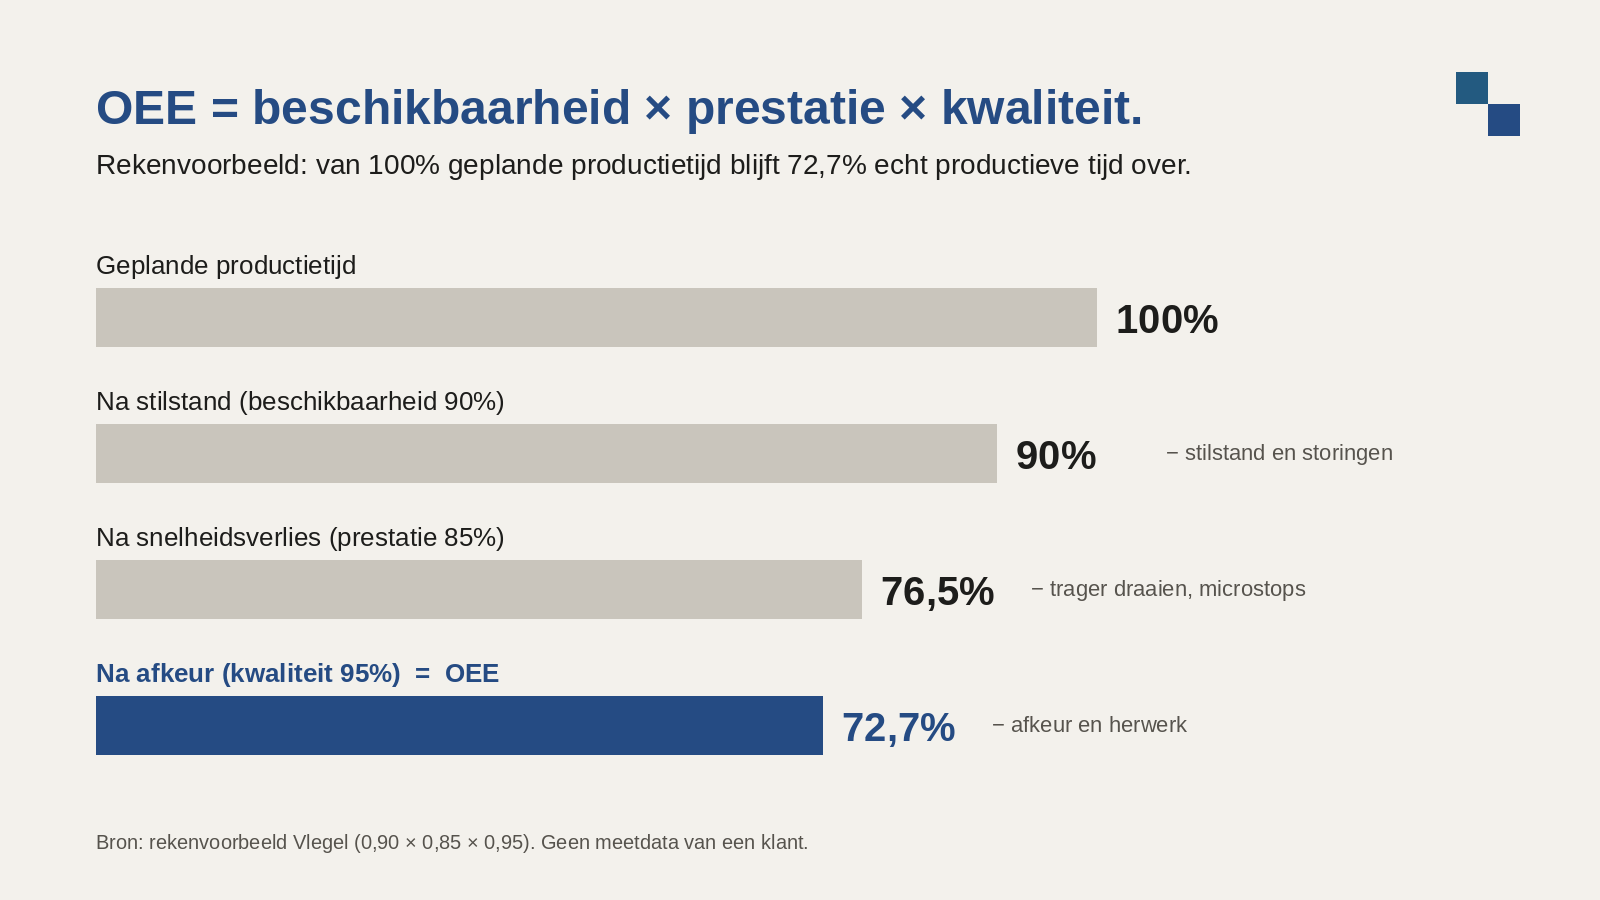
A worked example: availability 90%, performance 85% and quality 95%.
0.90 × 0.85 × 0.95 = 72.7% OEE
Three figures that each look "good enough" add up to a lot less. That’s why OEE is useful: it reveals losses that disappear when you look at each figure on its own.
What is a good OEE?
There’s no fixed number. 85% is often cited as world-class. But the comparison that matters is with your own line last month. A line with frequent changeovers will never match the OEE of one making the same product all year.
Why is measuring OEE worth it?
- You see where you’re losing out. Downtime, speed or rejects: OEE shows which of the three is costing you most.
- You get more from the same machines. Every percentage point of OEE is production you don’t have to buy with an extra line or shift.
- Your quality improves. Rejects are part of the figure. What gets measured gets attention.
- You make decisions based on numbers. A new machine, more maintenance or a different schedule? OEE per line lets you compare rather than guess.
- You waste less. Fewer rejects and fewer hours running without useful output mean less energy and raw material per good product.
Where do you start improving OEE?
An OEE project across all lines at once takes a long time to deliver results. Start small:
- Choose one line and one question. For example: "Why does line 3 stop?"
- Use the data you already have. Most machines and PLCs already know when they’re running and how much they produce. Give every signal a clear name and meaning.
- Let the operator enter the reason. Data shows that a line stopped, not why. The operator knows. One click per stop is enough.
- Show it on one screen. Operators see their own line; management sees all lines side by side.
- Does it work? Move to the next line. The first line becomes the template for the rest.
There’s another benefit. Every stop with a recorded reason captures troubleshooting knowledge that no longer lives only in someone’s head. With enough historical data, AI can later suggest a likely cause when a new stop occurs, based on what happened before. The operator decides. That’s how your OEE data becomes the foundation for Industrial AI.
How did Sodiko approach it?
Drinks bottler Sodiko in Diepenbeek could see that its bottling lines were stopping, but not why. We started with the lines that already had data. Today, a shop floor app runs on four lines: the machines supply the data, the operator enters the reason for each stop on their screen, and the app calculates OEE per line. Read the full Sodiko case study.
How does OEE relate to OOE, TEEP, MTTR and MTBF?
OEE looks at planned production time. Other metrics take a broader view, or focus on one aspect:
| Metric | What it measures | Formula |
|---|---|---|
| OOE (Overall Operations Effectiveness) | Like OEE, but measured against all factory opening hours, including planned stops | OEE × (planned production time ÷ operating time) |
| TEEP (Total Effective Equipment Performance) | Measured against all calendar time, 24/7 | OEE × (planned production time ÷ calendar time) |
| MTTR (Mean Time to Repair) | How long a breakdown lasts on average | total repair time ÷ number of breakdowns |
| MTBF (Mean Time Between Failures) | How long a machine runs on average between two breakdowns | total run time ÷ number of breakdowns |
Microstops are not a separate metric. They’re included in performance. If you want to see them separately, record them under their own downtime reason.
Conclusion
OEE shows how much of your planned time actually produces good products. The value isn’t in the number, but in the reason behind each loss. Start with one line, let the operator enter the reason and only expand once it works.
Want to know where your line is losing time? We’ll look at one line together and tell you honestly what to measure first. Book a chat
Read also: Sodiko now sees why its bottling lines stop · Bespoke or off-the-shelf software? · For factories
Source: OEE.com, World-Class OEE
Frequently asked questions
What is OEE in one sentence?
OEE is the percentage of your planned production time that actually produces good products, at the speed the machine should achieve.
How do you calculate OEE?
Multiply availability, performance and quality. For example, 0.90 × 0.85 × 0.95 = 72.7%.
What is the difference between OEE and TEEP?
OEE uses planned production time. TEEP uses all calendar time, 24 hours a day and 7 days a week. TEEP shows how much capacity you’re leaving unused.
Do I need an MES to measure OEE?
No. You can start with the data your machines already provide, plus a simple screen where the operator enters the reason for a stop.
What does OEE have to do with AI?
AI needs data with a name, a meaning and context. Stops with recorded reasons are exactly that. Measuring OEE properly today lays the groundwork for AI to suggest causes later.